A) \[{{T}_{1}}\,\,>\,\,{{T}_{2}}\]
B) \[{{T}_{1}}\,\,\approx \,\,{{T}_{2}}\]
C) \[{{T}_{1}}\,\,=\,\,{{T}_{2}}\]
D) \[{{T}_{1}}\,\,<\,\,{{T}_{2}}\]
Correct Answer: A
Solution :
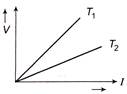
Slope of the \[V-i\] curve at any point equal to resistance at that point. From the curve slope for \[{{T}_{1}}>\,\,slope\,\,for\,\,{{T}_{2}}\] \[=\,\,\,{{R}_{{{T}_{1}}}}\,\,>\,\,{{R}_{{{T}_{2}}}}\]. Also at higher temperature resistance will be higher \[{{T}_{1}}\,\,>\,\,{{T}_{2}}\].


You need to login to perform this action.
You will be redirected in
3 sec

