| The electric potential, V as a function of distance (x) is shown in the figure. Construct a graph of the electric field strength, E versus distance x. |
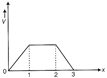 Graph electric potential versus distance
|
| OR |
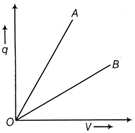
| The graph shows the variation of charge q versus potential difference V for two capacitors, \[{{C}_{1}}\] and \[{{C}_{2}}.\] The two capacitors have the same plate separation but the plate area of \[{{C}_{2}}\] is double than that of \[{{C}_{1}}.\] |
| Which of the lines in the graph correspond to \[{{C}_{1}}\] and \[{{C}_{2}}\] and why? |
 Variation of charge versus potential
|
Answer:
Electric field intensity 'E' and electric potential ?V? are related as \[E=-\frac{dV}{dx},\] where x is distance. So, negative slope of V versus x graph will give the value of electric field. Graph of the electric field strength, E versus distance x is given below. 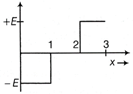 Electric field strength versus distance \[\because \]Electric field intensity and electric potential are related as \[E=\frac{-dV}{dx}\] =Negative slope of \[V\text{-}x\] graph. Here, when \[0<x<1,\] slope is positive and constant Then, \[\frac{dV}{dx}>0\] \[\therefore \] Electric field intensity is constant \[=-E\] For 1 < x < 2 slope \[=0\Rightarrow E=0\] For \[2<x<3,\] \[dV/dx<0\] and constant \[\therefore \] Electric field is positive and constant \[=+E\] Or The slope of q versus V graph wilt give capacitance, also we know that, \[C={{\varepsilon }_{0}}A/d\] [\[{{\varepsilon }_{0}}\] is permittivity of free space, A is area of plate of capacitor, d is distance between plates of capacitor] \[\therefore \] \[C=\frac{{{\varepsilon }_{0}}A}{d}=\frac{q}{V}\] \[\because \] d is a constant. \[\therefore \] \[C\propto A\] \[\Rightarrow \] Slope of graph \[\propto \] A (area of plate) \[\Rightarrow \] Higher the area of plates of capacitor = Higher the slope of graph. So, graph A represents \[{{C}_{2}}\] and graph B represents \[{{C}_{1}}.\]


You need to login to perform this action.
You will be redirected in
3 sec

