| Sketch the graph, showing the variation of stopping potential with frequency of incident radiation for two photosensitive metals A and B having threshold frequencies \[{{v}_{0}}'\]and \[{{v}_{0}},\] respectively \[(v{{'}_{0}}>{{v}_{0}}).\] |
| (i) Which of the two metals, A or B has higher work function? |
| (ii) What information do you get from the slope of the graphs? |
| (iii) What does the value of the intercept of graph on the potential axis represent? |
Answer:
Since, \[K{{E}_{\max }}=hv-\phi \] (Einstein's photoelectric equation) \[\Rightarrow \] \[e{{V}_{0}}=hv-\phi \] Dividing by e on both sides, we get \[{{V}_{0}}=\left( \frac{h}{e} \right)v-\frac{\phi }{e}\] If we compare it with, \[y=mx+c\] Then, \[Y={{V}_{0}}\] and \[m=\frac{h}{e},\] \[x=v\] and \[c=\frac{-\phi }{e}\] Graph of stopping potential versus frequency of incident radiation is given below. 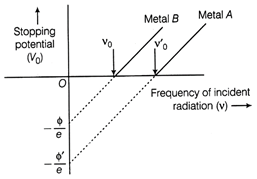 Graph of stopping potential versus frequency of incident radiation (i) Work function, \[\phi =h{{v}_{0}}\Rightarrow \phi \propto {{v}_{0}}\] Higher the threshold frequency = Higher the work function. According to the question, \[{{v}_{0}}'>{{v}_{0}}\] \[\therefore \] Metal A have higher work function \[(\phi ).\] (ii) By Einstein's photoelectric equation, \[K{{E}_{\max }}=hv-\phi \] or \[e{{V}_{0}}=hv-\phi ;\] \[{{V}_{0}}=\left( \frac{h}{e} \right)v-\frac{\phi }{e}\] \[\left[ comparing\,\,with\,\,y=mx+c\,\,and\,\,m=\frac{h}{e} \right]\] The slope of \[({{V}_{0}}\,versus\,\,v)\] graph \[=\frac{h}{e}\] constant (iii) Intercept of graph on the potential axis \[=-\frac{\phi }{e}\] \[\left[ \because c=\frac{-\phi }{e} \right]\]


You need to login to perform this action.
You will be redirected in
3 sec

