| Directions: Study the following graph and answer the given questions. [IBPS (SO) IT 2014] |
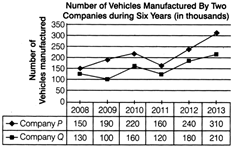 |
| Out of the number of vehicles manufactured by company P in 2012, 15000 pieces were found defective and out of the number of vehicles manufactured by company Q in 2013, 10000 pieces were found defective. What is the respective ratio of non-defective vehicles manufactured by company P in 2012 and Q in the 2013? |
A) 9 : 8
B) 11 : 4
C) 3 : 8
D) 5 : 8
E) 7: 4
Correct Answer: A
Solution :
| Total vehicles produced by P in 2012 = 240 thousands |
| Defective = 15 thousand |
| Non-defective = 225 thousands |
| Total vehicles produced by Q in 2013 = 210 thousand |
| Defectives = 10 thousands |
| Non-defective = 200 thousands |
| Ratio = 225: 200 = 9: 8 |


You need to login to perform this action.
You will be redirected in
3 sec

