| Directions: Study the following graph carefully to answer the questions that follow, |
| Number of students (in hundred) from two different schools who qualified in an exam in six different years |
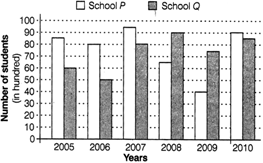 |
| What was the respective ratio between the number of students who qualified in the exam from school P in the year 2005 and the number of students who qualified in the exam from school Q in the year 2008? |
A) 13 : 18
B) 17 : 18
C) 17 : 19
D) 13 :19
E) None of these
Correct Answer: B
Solution :
| \[\text{Ratio}=\frac{\text{Students}\,\,\text{qualified}\,\,\text{from}\,\,\text{P}\,\,\text{in}\,\text{2005}}{\text{Students}\,\,\text{qualified}\,\,\text{from}\,\,\text{Q}\,\,\text{in}\,\,\text{2005}}\] |
| \[=\frac{85}{90}=\frac{17}{18}\] |


You need to login to perform this action.
You will be redirected in
3 sec

