| Directions: Study the following graph carefully to answer the given questions. [SBI (PO) 2014] |
| Number of Students Playing Carrom, Cricket and Hockey from Different Schools |
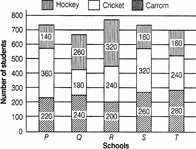 |
| If the number of students playing each game in school S is increased by 15% and the number of students playing each game in school Q is decreased by 5%, what will be the difference between the number of students in school S and Q? |
A) 54
B) 218
C) 366
D) 224
E) 206
Correct Answer: E
Solution :
| Total number, of students playing hockey in school |
| \[S=160\] |
| Total number of students playing cricket in school |
| \[S=320\] |
| Total number of students playing carrom in school |
| \[S=260\] |
| Similarly, for school Q playing hockey \[=260\] |
| Playing cricket \[=180\] |
| Playing carrom \[=240\] |
| \[\therefore \]Required difference |
| \[=\left( \frac{260\times 115}{100}+\frac{320\times 115}{100}+\frac{160\times 115}{100} \right)\] |
| \[-\left( \frac{240\times 95}{100}+\frac{180\times 95}{100}+\frac{260\times 95}{100} \right)\] |
| \[=(2.60\times 115+3.20\times 115+1.60\times 115)\] |
| \[-\,\,(2.40\times 95+1.80\times 95+2.60\times 95)\] |
| \[=\,\,(299+368+184)-(228+171+247)\] |
| \[=851-646=205\] |


You need to login to perform this action.
You will be redirected in
3 sec

