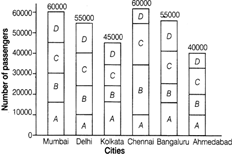
| Directions: The following bar diagram shows the number of passengers carried to different cities in first quarter of a year by four airlines, A, B, C and D has been given. Study the following diagram carefully and answer the questions. [Corporation Bank (SO) 2014] |
 |
| The number of passengers going to Bengaluru and Kolkata in first quarter by airline B is what per cent of the number of passengers going to the same cities in second quarter, if there be an increase of 30% in the number of passengers going to Bengaluru from first quarter to second quarter and in that going to Kolkata shows a 40% increase from first to second quarter? |
A) 68
B) 60
C) 65
D) 70
E) 74
Correct Answer: E
Solution :
| Passengers of airline 6 who travelled to Bengaluru |
| First quarter \[=10000\] |
| Second quarter \[=\frac{10000\times 130}{100}=13000\] |
| Passengers of airline B who travelled to Kolkata |
| First quarter \[=10000\] |
| Second quarter \[=\frac{10000\times 140}{100}=14000\] |
| \[\therefore \]Required percentage \[=\frac{20000}{27000}\times 100=74\]% |


You need to login to perform this action.
You will be redirected in
3 sec

