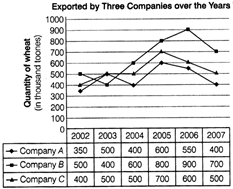
| Directions : Study the following graph carefully to answer the questions. [NICL (AO) 2014] |
 |
A) 2005
B) 2004
C) 2007
D) 2006
E) 2008
Correct Answer: B
Solution :
| [b] Rise is export in 2003 |
| \[=\frac{400-500}{500}\times 100=-\frac{100}{500}\times 100=-\,20%\] |
| Rise in export in 2004 |
| \[=\frac{600-400}{400}\times 100=\frac{200}{400}\times 100=50%\] |
| Rise in export in 2005 |
| \[=\frac{800-600}{600}\times 100=\frac{200}{600}\times 100=33.33%\] |
| Rise in export in 2006 |
| \[=\frac{900-800}{800}\times 100=\frac{100}{800}\times 100=12.5%\] |
| Rise in export in 2007 |
| \[=\frac{700-900}{900}\times 100=\frac{-\,200}{900}\times 100=-\,22.22%\] |
| From above it is clear that per cent rise in export is maximum in the year 2004. |


You need to login to perform this action.
You will be redirected in
3 sec

