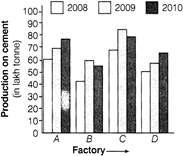
| Directions: Study the following graph and answer these questions that follow. The following graph shows the production of cement (in lakh tonne) of four factories A, B, C and D over the years. [SSC (CPO) 2013] |
 |
| Which of the four factories has recorded the maximum percentage growth in production of cement from 2008 to 2009? |
A) D
B) A
C) B
D) C
Correct Answer: C
Solution :
| Percentage increase in the production of cement from the year 2008 to the year 2009, |
| for factory \[A=\frac{70-60}{60}\times 100\]%=16.66% |
| for factory \[B=\frac{60-40}{40}\times 100\]%=50% |
| for factory \[C =\frac{85-65}{65}\times 100\]%=30.77% |
| for factory \[D=\frac{60-50}{50}\times 100\]%=20% |
| Thus, percentage increase was maximum for factory B. |


You need to login to perform this action.
You will be redirected in
3 sec

