| Directions: Study the following graph and answer these questions that follow. The following graph shows the production of cement (in lakh tonne) of four factories A, B, C and D over the years. [SSC (CPO) 2013] |
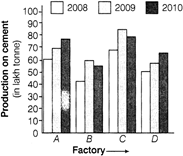 |
| The difference (in lakh tonne) between the average production of cement by four factories in 2009 and average production by the same factories in 2008 is |
A) 12.75
B) 11.50
C) 11.75
D) 15
Correct Answer: D
Solution :
| Required difference |
| \[=\left( \frac{70+60+85+60}{4} \right)-\left( \frac{60+40+65+50}{4} \right)\] |
| \[=\frac{275}{4}-\frac{215}{4}=\frac{60}{4}=15\,\,\text{lakh}\,\,\text{tonne}\] |


You need to login to perform this action.
You will be redirected in
3 sec

