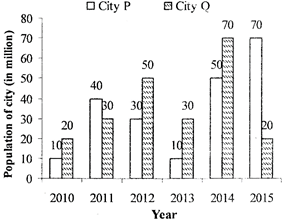
Directions (Q. 61 - 65): Study the following graph carefully to answer the given questions: The bar graph shows the population of City P and City Q over the years
 The table shows the percentage distribution of male and female population in City P and Q in different years.
| Years | City P | City Q | % literature | ||
| % male | % female | % male | % female | ||
| 2010 | - | 65 | 28 | - | 28 |
| 2011 | 35 | - | 32 | - | 72 |
| 2012 | - | 48 | 65 | 62 | |
| 2013 | 42 | - | - | 27 | 65 |
| 2014 | - | 38 | - | 38 | 45 |
| 2015 | 62 | - | 45 | - | 55 |
A) 145 : 147
B) 203 : 45
C) 145 : 203
D) 147 : 203
E) 203 : 148
Correct Answer: B
Solution :
Required ratio\[\text{=}\frac{\text{65 }\!\!%\!\!\text{ }\,\,\text{of}\,\,\text{50+27 }\!\!%\!\!\text{ }\,\,\text{of}\,\,\text{30}}{\text{65 }\!\!%\!\!\text{ }\,\,\text{of}\,\,\text{10+45 }\!\!%\!\!\text{ }\,\,\text{of}\,\,\text{50}}\] \[=\frac{32.5+8.1}{6.5+22.5}=\frac{40.6}{29}=\frac{406}{290}=\frac{203}{145}\]


You need to login to perform this action.
You will be redirected in
3 sec

