Answer:
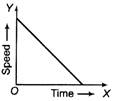
Graph (i) show that the speed decreases continuously with time. Therefore, it shows retardation. (1)
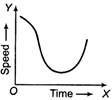
Graph (ii) show that speed first decreases, then increases with time. Therefore, the body shows first non-uniform retardation and then non-uniform acceleration. (2)


You need to login to perform this action.
You will be redirected in
3 sec

