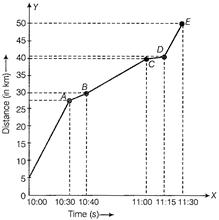
| Time | Distance (in km) |
| 10:00 am | 0 |
| 10:30 am | 25 |
| 10:40 am | 28 |
| 11:00 am | 40 |
| 11:15 am | 42 |
| 11:30 am | 50 |
Answer:
Equations of motion by graphical
method
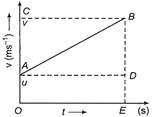
Consider an object moving along
a straight line with an initial velocity u and uniform acceleration a. Suppose,
it travels adistance, s in time, t. As shown in figure its velocity-time graph is
a straight line.
Here, ![]() (1)
(1)
 (1)
(i) Equation for Velocity-time
Relation
We know that
(1)
(i) Equation for Velocity-time
Relation
We know that
 Acceleration = Change in
Velocity/Time
Acceleration = Change in
Velocity/Time
![]()
![]()
![]()
![]() This proves the first equation
of motion. (1)
(ii) Equation for Position-time
Relation
Distance travelled by an object
in time t is s.
s = Area of the trapezium OABE
= Area of OADE + Area of ADB
or
This proves the first equation
of motion. (1)
(ii) Equation for Position-time
Relation
Distance travelled by an object
in time t is s.
s = Area of the trapezium OABE
= Area of OADE + Area of ADB
or![]() ...(i)
Now, DB = BE - DE = v - u = at Putting
this value for DB in Eq. (i), weget
...(i)
Now, DB = BE - DE = v - u = at Putting
this value for DB in Eq. (i), weget
![]() This proves the second equation
of motion. (1)
(iii) Equation for Position-velocity
Relation
The distance travelled by an
object in time t is
s = Area of the trapezium OABE
This proves the second equation
of motion. (1)
(iii) Equation for Position-velocity
Relation
The distance travelled by an
object in time t is
s = Area of the trapezium OABE
![]()
![]() Substituting EB, ED and OE with
v, u and t, we get
Substituting EB, ED and OE with
v, u and t, we get
![]() ...(ii)
But from the first equation of
motion, we know that
...(ii)
But from the first equation of
motion, we know that
![]() or
or ![]() Substituting t in Equation (ii)
with this value, we get
Substituting t in Equation (ii)
with this value, we get
![]()
![]() or
or ![]()
![]() (1)
This proves the third equation of motion.
(1)
Or
(i) Distance-time graph
(ii) Average speed
(1)
This proves the third equation of motion.
(1)
Or
(i) Distance-time graph
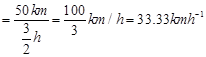
(ii) Average speed![]() In this problem, total distance
travelled = 50 km
Total time taken 10:00 AM to
11:30 AM = 1 hour 30 minutes
In this problem, total distance
travelled = 50 km
Total time taken 10:00 AM to
11:30 AM = 1 hour 30 minutes ![]()
![]() Now average
speed
Now average
speed
 (iii) We know, speed = slope of
distance-time graph. The greater the slope, the greater is the speed. From the
graph it is clear that slope of distance-time graph is maximum between 10:00 AM
to 10:30 AM, so thetrain was travelling at the highest speed during this
interval of time.
(iv) The part CD of the graph
has minimum slope, so the train had minimum speed between 11:00 AM and 11:15
AM, Thus, the train had slowed down between 40 km and 42 km.
(v) Speed between 10:40 AM to
11:00 AM
(iii) We know, speed = slope of
distance-time graph. The greater the slope, the greater is the speed. From the
graph it is clear that slope of distance-time graph is maximum between 10:00 AM
to 10:30 AM, so thetrain was travelling at the highest speed during this
interval of time.
(iv) The part CD of the graph
has minimum slope, so the train had minimum speed between 11:00 AM and 11:15
AM, Thus, the train had slowed down between 40 km and 42 km.
(v) Speed between 10:40 AM to
11:00 AM
![]() (1x5)
(1x5)


You need to login to perform this action.
You will be redirected in
3 sec

