| Direction: Study the following graph and answer the given questions. |
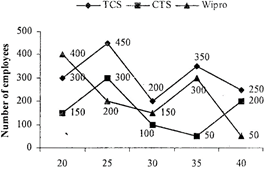
| Data related to the number of employees and their salaries (in thousand rupees per month) in different IT companies |
 |
A) 15 : 4
B) 17 : 7
C) 19 : 9
D) 21 : 19
E) 9 : 19
Correct Answer: C
Solution :
Reqd ratio = (450 + 300 + 200): (100 + 150 + 200) = 950 : 450 = 19 : 9


You need to login to perform this action.
You will be redirected in
3 sec

