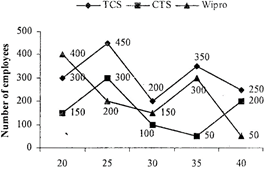
| Direction: Study the following graph and answer the given questions. |
| Data related to the number of employees and their salaries (in thousand rupees per month) in different IT companies |
 |
A) 82.35%
B) 79.75%
C) 84.33%
D) 87.65%
E) 72.35%
Correct Answer: A
Solution :
\[\text{Read }\!\!%\!\!\text{ =(350+300+50)}\times \frac{100}{(150+400+300)}\] \[=700\times \frac{100}{850}=82.35%\]


You need to login to perform this action.
You will be redirected in
3 sec

