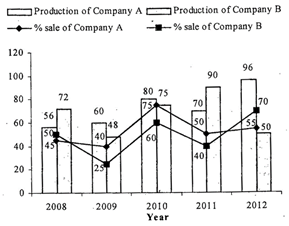
| Direction: The following bar graph shows the production of cycle (in thousand) by two companies A and B over the period 2008-2012 and the tine-graph shows the percentage sale of these companies. |
 |
A) 181
B) 190
C) 197
D) 204
E) 212
Correct Answer: C
Solution :
Sale of Company \[A=56\times \frac{45}{100}+60\times \frac{40}{100}+80\times \] \[\frac{75}{100}+70\times \frac{50}{100}+96\times \frac{55}{100}\] \[=25.2+24+60+35+52.8=197\]thousand


You need to login to perform this action.
You will be redirected in
3 sec

