| Direction: Study the following table and graph carefully and answer the questions give below. |
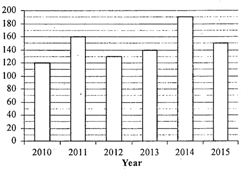
| Income of a company (in Rs. lakh) |
 |
| Percentage profit over the years |
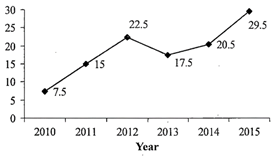 |
A) 2011
B) 2013
C) 2014
D) 2012
E) None of these
Correct Answer: A
Solution :
; In \[2011\to \frac{15-7.5}{7.5}\times 100=100%\,\]increase Similarly, In \[2012\to \frac{22.5-15}{15}\times 100\] \[=\frac{7.5}{15}\times 100=50%\]increase In \[2013\to \frac{-22.5+17.5}{+22.5}\times 100\] \[=\frac{-5}{22.5}\times 100=-\frac{50\times 100}{225}=-\frac{50\times 4}{9}\] \[=-\frac{200}{9}=-22\frac{2}{7}%=22\frac{2}{7}%\]decrease In \[2014\to \frac{20.5-17.5}{17.5}\times \frac{3}{17.5}\times 100=17\frac{1}{7}%\]increase In \[2015\to \frac{29.5-20.5}{20.5}\times 100=43\frac{37}{41}%\]increase Hence in the year 2011 the percentage increase in percentage profit from the previous year is the maximum.


You need to login to perform this action.
You will be redirected in
3 sec

