| Direction: Study the following graph carefully and answer the question given below it. |
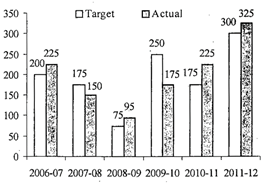
| Target and Actual production of cement (in 1,000 ginny bags) of a factory over a period of six years. |
 |
A) 2010-11
B) 2011-12
C) 2008-09
D) 2006-07
E) 2008-2009
Correct Answer: A
Solution :
; Reqd percentage in \[2006-07=\frac{225}{200}\times 100=112.5%\] Similarly, in \[2010-11=\frac{225}{175}\times 100=128.57%\] In \[2011-12=\frac{125}{300}\times 100=108.33%\] Hence in 2010-11 the actual production is the highest as compared to the target production.


You need to login to perform this action.
You will be redirected in
3 sec

