| Direction: Study the given bar graph and pie chart to answer the following questions. |
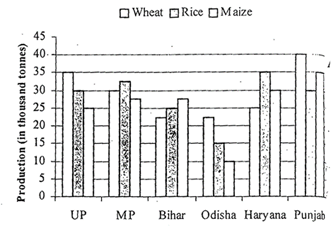
| The bar graph shows the production (in thousand tonnes) of Wheat, Rice and Maize in different states. |
|
| State |
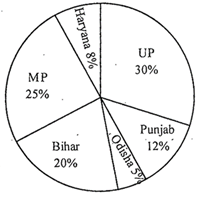
| The pie-chart shows the percentage of agriculture land in the given six states- \[\text{Productivity=}\frac{\text{Total}\,\text{production}}{\text{Area}\,\text{of}\,\text{agricultural}\,\text{land}}\] |
|
| Total agricultural land = 2 lakh square km |
A) 65:48
B) 31:42
C) 43:54
D) 57:62
E) 1:2
Correct Answer: A
Solution :
Income of MP from export of 40% of Rice at the rate of 30 per kg \[=32500\times \frac{40}{100}\times 1000\times 30=\]Rs.39 crore Income of UP from export of 30% of Rice at the rate of 32 per kg \[=30000\times 1000\times \frac{30}{100}\times 32=\]28.8 crore \[\therefore \]Reqd ratio = 39 : 28.8 = 390 : 288 = 65:48


You need to login to perform this action.
You will be redirected in
3 sec

