| Direction: Study the pie-chart and line graph carefully to answer the given questions. |
| The pie-chart shows the percentage of train accidents in different years |
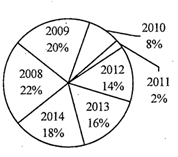 |
| Total number of train accidents = 200 The line graph shows the number of persons who died in train accidents in various states in different years |
 |
A) 8:7
B) 10:9
C) 12:11
D) 14:13
E) 16:15
Correct Answer: E
Solution :
The ratio of the number of deaths in 2010 to that in \[2014=\left( 100+300+500+700 \right):\left( 200+300+400+600 \right)\] \[=1600:1500=16:15\]


You need to login to perform this action.
You will be redirected in
3 sec

