| Direction: Study the pie-chart and line graph carefully to answer the given questions. |
| The pie-chart shows the percentage of train accidents in different years |
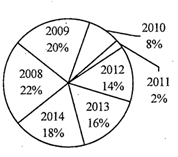 |
| Total number of train accidents = 200 The line graph shows the number of persons who died in train accidents in various states in different years |
A) Odisha
B) UP
C) Bihar
D) Only [a] and [b]
E) Marashtra
Correct Answer: B
Solution :
The number of deaths in train accidents in Bihar \[=100+300+300+200+500+600+400=2400\] Similarly, in UP= 500 + 600 + 500 + 700 + 600+700 + 600 =4200 In Maharashtra = 200 + 400 + 100 + 100 + 300 + 400 + 300=1800 In Odisha \[=300+200+700+600+400+500+200\]\[=2900\] In UP the number of people who died in train accidents is the maximum. Quicker method It is clear from the graph that the highest number of people died in UP.


You need to login to perform this action.
You will be redirected in
3 sec

