| Direction: Study the following radar graph carefully to answer the questions that follow: |
| Number of seats won by various political parties in the legislative assemblies of different states |
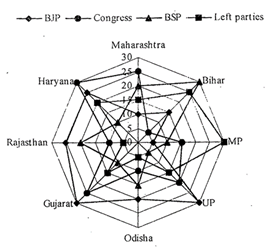 |
A) 8.21% more
B) 7.69% less
C) 6.56% more
D) 9.71% less
E) 10% less
Correct Answer: B
Solution :
Total number of seats won by BSP in all states \[=5+10+30+20+10+20+10+15=120\] Total number of seats won by Left Parties in all states \[=15+30+25+15+20+5+15+5=130\]\[130-120\] \[\therefore \]Reqd%\[=\frac{130-120}{130}\times 100\] \[=\frac{10}{130}\times 100\approx 7.69%\]less


You need to login to perform this action.
You will be redirected in
3 sec

