| Direction: Study the following graphs carefully to answer the question that follow: |
| The line graph shows the number of students in various departments in different cities. The pie-chart shows the percentage of faculty members in different cities. |
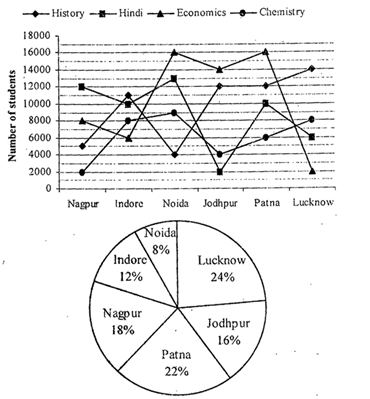 |
| Total number of faculty members =10000 |
A) Hindi
B) History
C) Either Hindi or Chemistry
D) Economics
E) Chemistry
Correct Answer: E
Solution :
Number of students in History \[=5000+11000+4000\]\[+\text{ }12000+\text{ }12000+\]\[14000=58000\] Number of students in Hindi \[=\text{ }12000+10000+13000+2000+10000+\] \[6000=53000\] Number of students in Economics \[=8000+6000+16000+1\text{ }4000+16000\text{ }+\] \[2000=62000\] Number of students in Chemistry \[=2000+8000+9000+4000+6000+\]\[8000=37000\] In Chemistry the number of students is the minimum.


You need to login to perform this action.
You will be redirected in
3 sec

