| Direction: Study the given pie-charts carefully and answer the questions given below: |
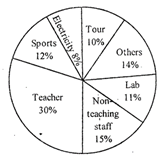
| The graph shows the expenditure of School A and School B in 2012 under various heads. |
| Total expenditure of School A = Rs.10 lakh. |
 |
| Section A |
 |
| School B |
A) Rs.3212.57
B) Rs.3658.53
C) Rs.2835.75
D) Rs.3789.47
E) Rs.2312.91
Correct Answer: C
Solution :
Salary of all the teachers in School A \[=1000000\times \frac{30}{100}=\]Rs. 300000 Number of new teachers \[=60\times \frac{30}{100}=18\] Number of new teachers \[=(60-18)=42\] Number of old teachers = (60 - 18) = 42 Let the salary of an old teacher be Rs.\[x.\] \[\therefore \]Salary of a new teacher \[\frac{x\times 60}{100}=\frac{3x}{5}\] Now, salary of Principal =Rs.\[\frac{11x}{10}\] So, \[x\times 41+\frac{11x}{10}+\frac{3x\times 18}{5}=300000\] or, \[\frac{410x+11x+54x}{10}=300000\] or, \[475x=300000\times 10\] \[\therefore \]\[x=\frac{300000\times 10}{475}=\]Rs. 6315.78 Salary of a new teacher \[=6315.78\text{ }x\text{ }-=3789.47\]


You need to login to perform this action.
You will be redirected in
3 sec

