| Direction: Study the given pie-charts carefully and answer the questions given below: |
| The graph shows the expenditure of School A and School B in 2012 under various heads. |
| Total expenditure of School A = Rs.10 lakh. |
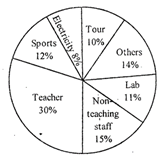 |
| Section A |
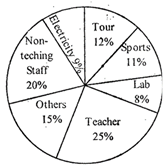 |
| School B |
A) Rs.1.5 lakh
B) Rs.1.1 lakh
C) Rs.2 lakh
D) Rs.2.51akh
E) Rs.1.97 lakh
Correct Answer: B
Solution :
Total expenditure of School B \[=1000000\times \frac{95}{100}=\]Rs. 95000=Rs. 9.5 lakh \[\therefore \]Expenditure on non-teaching staff of School A \[=1000000\times \frac{30}{100}=\]Rs. 300000 =Rs. 3 lakh Expenditure on non-teaching staff of school \[B=95000\times \frac{20}{100}=\]Rs.\[190000=\]Rs. 1.9 lakh \[\therefore \]Reqd difference\[=(3\,lakh-1.9\,\text{lakh})=\]Rs. 1.1 lakh


You need to login to perform this action.
You will be redirected in
3 sec

