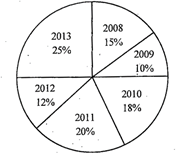
| Direction: Study the following pie-chart and line graph and answer the question given below: |
| The pie-chart shows the percentage of foreign currencies present in the Indian Economy in various years. |
 |
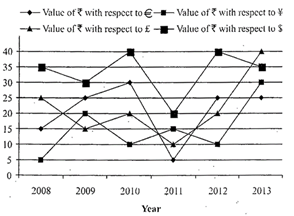
| The line graph shows the value of with respect to other currencies -¥ (yen), $ (dollar), £ (pound) and\[\in \](euro). |
 |
A) Rs.25
B) Rs.28
C) Rs.30
D) Rs.32
E) Rs.39
Correct Answer: A
Solution :
Value of yen in 2010 = Rs.10 Value of dollar in 2013 =Rs.35 \[\therefore \]Reqd difference\[=35-10=\]Rs.25


You need to login to perform this action.
You will be redirected in
3 sec

