| Direction: Study the following graphs carefully to answer the question that follow: |
| The line graph shows the number of students in various departments in different cities. The pie-chart shows the percentage of faculty members in different cities. |
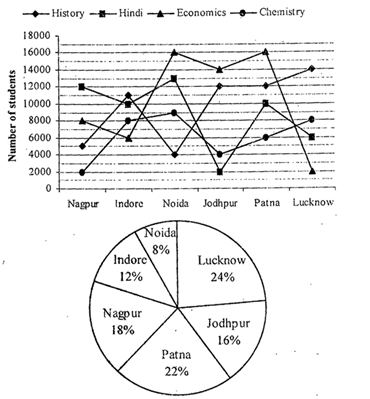 |
| Total number of faculty members =10000 |
A) Jodhpur
B) Noida
C) Patna
D) Lucknow
E) Nagpur
Correct Answer: B
Solution :
\[\text{In}\,\text{Nagpur}\to \frac{\text{Number}\,\text{of}\,\text{students}}{\text{Number of faculty members}}\] \[=\frac{2000+5000+8000+12000}{10000\times \frac{18}{100}}=15\] \[\text{Indore}\to \frac{6000+8000+10000+11000}{10000\times \frac{12}{100}}=29.16\approx 29\] In Noida \[\to \frac{4000+9000+13000+16000}{10000\times \frac{8}{100}}=52.5\approx 53\] In Jodhpur \[\to \frac{2000+4000+12000+14000}{10000\times \frac{16}{100}}=20\] In Patna \[\to \frac{6000+10000+12000+16000}{10000\times \frac{22}{10}}=20\] In Lucknow \[\to \frac{2000+6000+8000+14000}{10000\times \frac{24}{100}}=12.5\]\[\approx 13\]faculty members In Noida the number of students per teacher is the maximum.


You need to login to perform this action.
You will be redirected in
3 sec

