| Direction: Study the pie-chart and line graph to answer the question. |
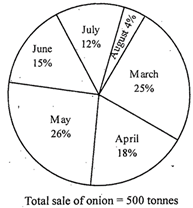
| The pie-chart Shows the percentage sales of onion in different months. |
 |
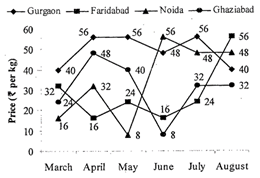
| The line graph shows the price of onion in different months in different cities |
 |
A) March
B) August
C) July
D) April
E) June
Correct Answer: A
Solution :
Average price of onion in March \[=\frac{1}{4}\times (16+24+32+40)=\]Rs. 28 per kg Average price of onion in April \[=\frac{1}{4}\times (16+32+48+36)=\]Rs. 33 per kg Average price of onion in May \[=\frac{1}{4}\times (8+24+40+56)=\]Rs. 32 per kg Average price of onion in June \[=\frac{1}{4}\times (8+16+48+56)=\]Rs. 32 per kg Average price of onion in July \[=\frac{1}{4}\times (24+32+48+56)=\]Rs. 40 per kg Average price of onion in August \[=\frac{1}{4}\times (32+40+48+56)=\]Rs. 44 per kg In August the average price of onion per kg is the maximum and in March the average price of onion is the minimum.


You need to login to perform this action.
You will be redirected in
3 sec

