| Direction: Study the charts carefully and answer the question based on it. |
| The following pie-charts show the percentage of production of various vehicles by two companies A and B in the year 2014. |
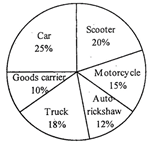 |
| Company A |
| Total production = 32000 |
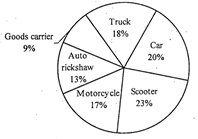 |
| Company B |
| Total production = 22000 |
A) 4688
B) 3768
C) 3878
D) 3648
E) 3688
Correct Answer: E
Solution :
Total production of Trucks by Company A \[=\frac{18\times 32000}{100}=5760\] No. of Trucks sold by Company A \[=\frac{5760\times 80}{100}=4608\] Total production of Goods Carriers and Autorickshaws by Company B \[=\frac{(13+9)}{100}\times 22000=4840\] Total unsold Trucks of Company A \[=5760-4608=1152\] \[\therefore \]Difference \[=4840-1152=3688\]


You need to login to perform this action.
You will be redirected in
3 sec

