| Direction: Study the bar-graph and pie- chart to answer the question based on it. |
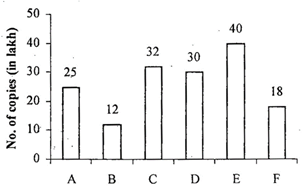
| The bar graph shows the no. of copies of newspapers sold (in lakh) by six different companies and the pie-chart shows the revenue generated by six companies in 2013. |
 |
| Company |
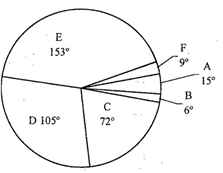 |
| Total revenue generated =Rs. 36 crore |
A) 6 times
B) Twice
C) \[\frac{10}{3}\] times
D) 16 times
E) None of these
Correct Answer: C
Solution :
The highest no. of copies sold by Company E is 40 lakh. The lowest no. of copies sold by Company B is 12 lakh. Reqd no. of times \[=\frac{40}{12}=\frac{10}{3}\]times


You need to login to perform this action.
You will be redirected in
3 sec

