| Direction: Study the pie-charts and bar graphs to answer the given question. |
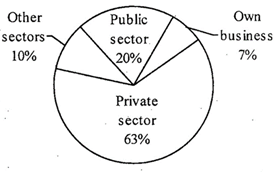
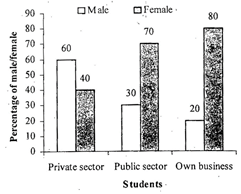
| Dream career choice among students and executives Students |
 |
| Total no. of students = 5500 |
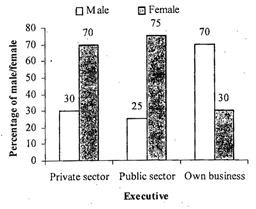
| Executives |
 |
| Total no. of executives = 4000 |
 |
 |
A) More
B) Less
C) Same
D) Can't be determined
E) None of these
Correct Answer: B
Solution :
From the graph the no. of female students is less than the no. of male students in Own business.


You need to login to perform this action.
You will be redirected in
3 sec

