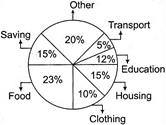
| Direction: The circle graph given here shows the spendings a family on various items during the year 2010. Study the graph and answer, the questions. |
| Per cent of money spent by a family on various items during 2010 |
 |
A) Rs. 2000
B) Rs. 10580
C) Rs. 23000
D) Rs. 2300
Correct Answer: B
Solution :
Total amount spent = Rs. 46000 Amount spent on food = 23% of 46000 \[=\frac{23}{100}\times 46000=Rs.10580\]


You need to login to perform this action.
You will be redirected in
3 sec

