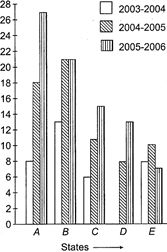
| Direction: The following graph shows the production of cotton bales of 100 kg each in lakhs by different states A, B, C, D and E over the years. Study the graph and answer the following questions. |
 |
A) 3
B) 2
C) 1
D) There is no such States
Correct Answer: B
Solution :
Required state are B and E.


You need to login to perform this action.
You will be redirected in
3 sec

