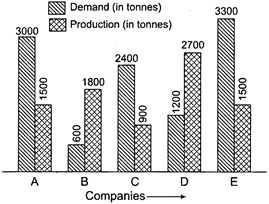
| Direction: The following graph shows the demand and production of cotton by 5 companies A, B, C, D and E. Study the graph and answer the questions given below. |
 |
A) 320
B) 420
C) 2100
D) 1050
Correct Answer: B
Solution :
Required difference \[=\left( \frac{3000+600+2400+1200+3300}{5} \right)\] \[-\left( \frac{1500+1800+900+2700+150}{5} \right)\] \[=2100-1600=420\] tonnes


You need to login to perform this action.
You will be redirected in
3 sec

