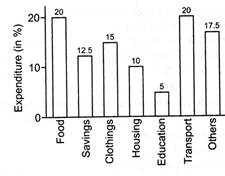
| Direction: The bar graph given below shows the spending of a family income on various items and savings during 2010. Observe the graph or answer the following questions. |
| Family Income spent during 2010 (in %) |
 |
A) 5
B) 10
C) 12.5
D) 20
Correct Answer: D
Solution :
It is obvious from the graph.


You need to login to perform this action.
You will be redirected in
3 sec

