Directions: Study the following graph carefully and answer the questions given below: Net profit percent of the two company A and B in different years 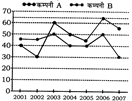 |
A) 121.5
B) 135
C) 140
D) Data Insufficient
Correct Answer: D
Solution :
\[\because \]Expenditure of the company B in 2002 and 2003 are not given separately


You need to login to perform this action.
You will be redirected in
3 sec

