| Directions for questions: Study the following bar graph carefully and answer the questions given below. |
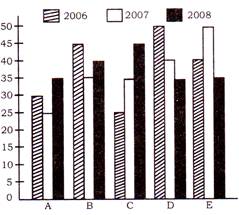
| Production of fertilizers (in lakh tonnes) by five companies in three years 2006, 2007 and 2008. |
 |
A) A
B) B
C) C
D) D
Correct Answer: C
Solution :
% Decrement of company \[A=\frac{30-25}{30}\times 100=16\frac{2}{3}%\] % Decrement of company \[B=\frac{45-35}{45}\times 100=22\frac{2}{9}%\] % Increment of Company. \[C=\frac{35-25}{25}\times 100=40%\] % Decrement of Company \[D=\frac{50-40}{50}\times 100=20%\] % Increment of Company \[E=\frac{50-40}{40}\times 100=25%\] \[\therefore \] Company \[\] has the highest increment of 40%.


You need to login to perform this action.
You will be redirected in
3 sec

