| Direction for question: Study the following graph carefully and answer the questions given below it. |
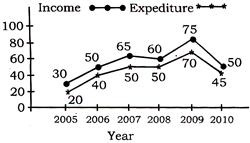
| Income and expenditure (in 100 crore) of a company |
 |
A) 2006
B) 2007
C) 2008
D) 2009
Correct Answer: A
Solution :
In \[2006=\frac{50-30}{30}=\frac{2}{3}=66\frac{2}{3}%\] In 2007 \[=\frac{15}{50}=30%\] In 2008 = Decreases In 2009 \[=\frac{15}{60}=\frac{1}{4}=25%\] So, year 2006 had highest percentage.


You need to login to perform this action.
You will be redirected in
3 sec

