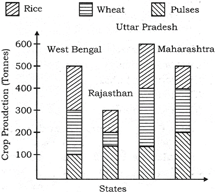
| Direction for question: The graph shows the quantities of different crop production in different state of India. Study the graph and answer the given question. |
 |
A) 175 tonnes
B)
![]() tonnes
tonnes
C)
![]() tonnes
tonnes
D) None of these
Correct Answer: A
Solution :
Average production of wheat from all states


You need to login to perform this action.
You will be redirected in
3 sec

