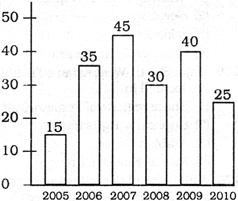
| Directions: Study the following bar-graph carefully and answer the questions given below it. |
| Amount of fertiliser manufactured by a company over the years (in thousand tons) |
 |
A) 1
B) 2
C) 3
D) None of these
Correct Answer: B
Solution :
The increase in manufacture from 2005 to 2006 \[=35-15=20\] The increase in manufacture from 2008 to 2009 \[=40-30=10\] \[\therefore \]Required answer\[=\frac{20}{10}=2\]


You need to login to perform this action.
You will be redirected in
3 sec

