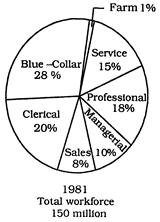
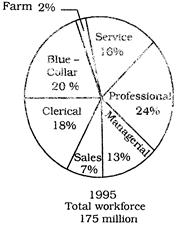
| Direction: The piechart given below shows the distribution of workforce by occupational category for country X in 1981 and 1995. Study the chart and answer the questions. |
  |
A) four
B) five
C) two
D) three
Correct Answer: D
Solution :
\[=\frac{150\times x}{100}=25\] \[\Rightarrow \] \[x=\frac{25\times 100}{150}=16\frac{2}{3}%\] Required answer = blue-collar, professional and clerical workers.


You need to login to perform this action.
You will be redirected in
3 sec

