
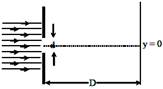
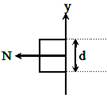
 In an experiment, electrons are made to pass through a narrow slit of width 'd' comparable to their de Broglie wavelength. They are detected on a screen at a distance 'D' from the slit (see figure). Which of the following graphs can be expected to represent the number of electrons 'N' detected as a function of the detector position 'y' (y = 0 corresponds to the middle of the slit)?
 AIEEE Solved Paper-2007
A)
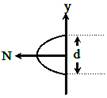
B)
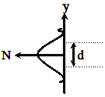
C)

D)
Correct Answer: B
Solution :
After diffraction electron beam will spread.





You need to login to perform this action.
You will be redirected in
3 sec