A)
B)
C)
D)
Correct Answer: C
Solution :
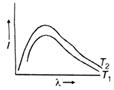
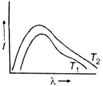
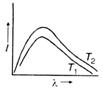
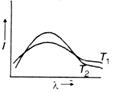
Lummer and pringsheim heated the black body to different temperatures and drew distribution curves for all temperatures on the same graph paper. These curves whose general shape is (shown). As the temperature increases the peak of the curve shifts towards shorter wavelength \[+\frac{G{{M}_{e}}m}{R}=\frac{1}{2}mv_{e}^{2}\] that is the maximum value off is obtained at smaller value of \[{{M}_{e}}\] Wiens established the following relation between temperature T and \[\therefore \] that is,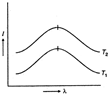 \[{{v}_{e}}=\sqrt{\frac{2G{{M}_{e}}}{{{\operatorname{R}}_{e}}}}\] Hence, as temperature of the black body rises the maximum energy of the emitted radiation shifts towards shorter wavelength.


You need to login to perform this action.
You will be redirected in
3 sec

