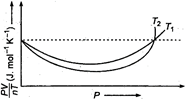
 Read the following statements concerning the above curves: (i) The dotted line corresponds to the ideal gas behaviour. (ii) \[{{T}_{1}}>{{T}_{2}}\] (iii) The value of \[\frac{PV}{nT}\] at the point where the curves meet on the y-axis is the same for all gases. Which of the above statements is true?
A) (i) only
B) (i) and (ii) only
C) All of these
D) None of these
Correct Answer: C
Solution :
(i) The dotted line in the diagram shows that PV there is no deviation in the value of \[\frac{PV}{nT}\] for different temperatures \[{{T}_{1}}\] and \[{{T}_{2}}\] for increasing pressure so, this gas behaves ideally. Hence, dotted line corresponds to ideal gas behaviour. (ii) At high temperature, the deviation of the gas is less and at low temperature the deviation of gas is more. In the graph, deviation for \[{{T}_{2}}\] is greater than for \[{{T}_{1}}\]. Thus, \[{{T}_{1}}>{{T}_{2}}\] (iii) Since, the two curves intersect at dotted PV line so, the value of \[\frac{PV}{nT}\] at that point on the y-axis is same for all gases.


You need to login to perform this action.
You will be redirected in
3 sec

