A) adiabatic
B) isobaric
C) isothermal
D) equal in all above cases
Correct Answer: B
Solution :
The P-V diagram for isobaric, isothermal and adiabatic processes of an ideal gas is shown in graph below: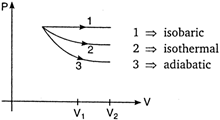 In thermodynamics, for same change in volume, the work done is maximum for the curve having area enclosed with the volume axis. Area enclosed by the curve \[\propto {{(Slope\,of\,curve)}^{-1}}\] As shown, \[{{(slope)}_{isobaric}}<{{(slope)}_{isothermal}}<{{(slope)}_{adiabatic}}\] \[\Rightarrow \]\[{{(Area)}_{isbaric}}>{{(Area)}_{isothermal}}>{{(Area)}_{adiabatic}}\] Hence, work done is maximum in isobaric process. NOTE: \[{{(Slope)}_{adiabatic}}=-\gamma \left( \frac{P}{V} \right)\] and \[{{(Slope)}_{isothemal}}=-\frac{P}{V}\] \[\therefore \] \[{{(Slope)}_{adiabtic}}=\gamma \times {{(Slope)}_{isothemal}}\]


You need to login to perform this action.
You will be redirected in
3 sec

