A) A
B) B
C) C
D) D
E) E
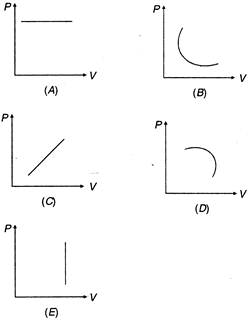
Correct Answer: B
Solution :
The isothermal curve on P-V diagram is like a hyperbola.


You need to login to perform this action.
You will be redirected in
3 sec

