A)

B)

C)

D)

Correct Answer: B
Solution :
\[\upsilon =\]velocity of sound. \[{{f}_{1}}=\frac{\upsilon }{\upsilon -u}f\]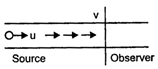 When source moves towards stationary observer. \[f=\frac{\upsilon }{\upsilon +u}f\] When source moves away from observer.
 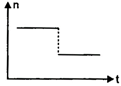 \[\therefore \] \[{{f}_{1}}<f\] f does not depend on time elapse (t).


You need to login to perform this action.
You will be redirected in
3 sec

