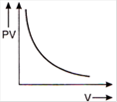
A)
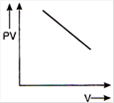
B)
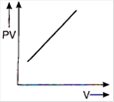
C)
D)
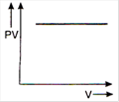
Correct Answer: D
Solution :
For an ideal gas keeping the temperature same throughout, PV = constant Hence, for a given mass, the graph between PV and V will be a straight line parallel to V-axis whatever may be the volume.


You need to login to perform this action.
You will be redirected in
3 sec

