A)
B)
C)
D)
Correct Answer: A
Solution :
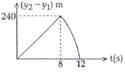
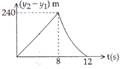
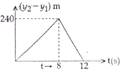
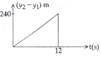
The displacement equation of the first object is\[{{y}_{1}}=10t-\frac{1}{2}g{{t}^{2}}=10t-5{{t}^{2}}\]and the final displacement is \[{{y}_{1}}=-240m\] so, \[-240=10t-5{{t}^{2}}\] \[5{{t}^{2}}-10t-240=0\] \[{{t}^{2}}-2t-48=0\] \[t=\frac{2\pm \sqrt{{{2}^{2}}+4\times 48}}{2}=8\sec \] time taken to reach the ground is 8sec, In the same way second object?s displacement equation is \[{{y}_{2}}=40t-5{{t}^{2}}\]and the taken to reach the ground is \[t=12\]sec. The relative displacement is \[{{y}_{2}}-{{y}_{1}}=30t\] when \[(0<t\le 8\sec )\] \[{{y}_{2}}-{{y}_{1}}=40t-5{{t}^{2}}\] when \[(8\le t\le 12\sec )\] So graph is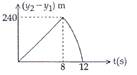


You need to login to perform this action.
You will be redirected in
3 sec

