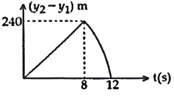
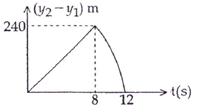
| Two stones are thrown up simultaneously from the edge of a cliff 240 m high with initial speed of m/s and 40 m/s respectively. Which of the following graph best represents the time variation of relative position of the second stone with respect of the first? |
| (Assume stones do not rebound after hitting the ground and neglect air resistance, take g = 10 m/s2) |
| (The figure are schematic and not drawn to scale) [JEE MAIN 2015] |
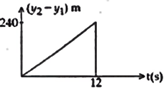
A)
B)
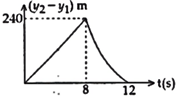
C)
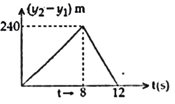
D)
Correct Answer: A
Solution :
| [a] The displacement equation of the first object is\[{{y}_{1}}=10t-\frac{1}{2}g{{t}^{2}}=10t-5{{t}^{2}}\]and the final displacement is \[{{y}_{1}}=-240m\] |
| so, \[-240=10t-5{{t}^{2}}\] |
| \[5{{t}^{2}}-10t-240=0\] |
| \[{{t}^{2}}-2t-48=0\] |
| \[t=\frac{2\pm \sqrt{{{2}^{2}}+4\times 48}}{2}=8\sec \] |
| time taken to reach the ground is 8sec, |
| In the same way second objects displacement equation is \[{{y}_{2}}=40t-5{{t}^{2}}\]and the taken to reach the ground is \[t=12\]sec. |
| The relative displacement is |
| \[{{y}_{2}}-{{y}_{1}}=30t\] when \[(0<t\le 8\sec )\] |
| \[{{y}_{2}}-{{y}_{1}}=40t-5{{t}^{2}}\] when \[(8\le t\le 12\sec )\] |
| So graph is |


You need to login to perform this action.
You will be redirected in
3 sec

